
In March 2024, Google is rolling out Interaction to Next Paint (INP). It’s a new Core Web Vitals metric to replace FID (First Input Delay).
In today’s article, I’ll break down everything you need to know about it to optimize your site for SEO and conversions.
What is Interaction to Next Paint?
Interaction to Next Paint (INP) is a new Core Web Vitals metric introduced by Google. In March 2024, it’s set to replace First Input Delay (FID).
Unlike FID, which only measures the delay in the first interaction, INP evaluates the responsiveness of a page throughout all user interactions. This makes it a more comprehensive and reliable metric for assessing web page responsiveness.
INP focuses on three main types of user interactions:
- Mouse clicks
- Taps on a touchscreen
- Key presses on a physical or onscreen keyboard
The latency of an interaction is measured from the start of the user interaction to the moment the next frame is presented with visual feedback.
It reports the worst latency for most sites (in general, the lowest 2% of UI responses). But for pages with a large number of interactions, it excludes one highest interaction for every 50 interactions to give a better measure of actual responsiveness.
That way, it can capture the worst user experiences on a page rather than an average or best-case scenario.
Why did Google ditch First Input Delay?
First Input Delay failed to detect UX problems across websites because, well, it only looked at the first interaction’s input delay. Clunky or slow interactions during a longer session would go overlooked.
Interaction to Next Paint improves on this shortcoming in two critical ways:
- It considers all the time between when a user interacts and when the next visual feedback appears.
- It measures every type of user interaction (clicks, taps, and typing) instead of just the first one.
This means you’re getting a more accurate and complete picture of your page’s responsiveness and user experience.
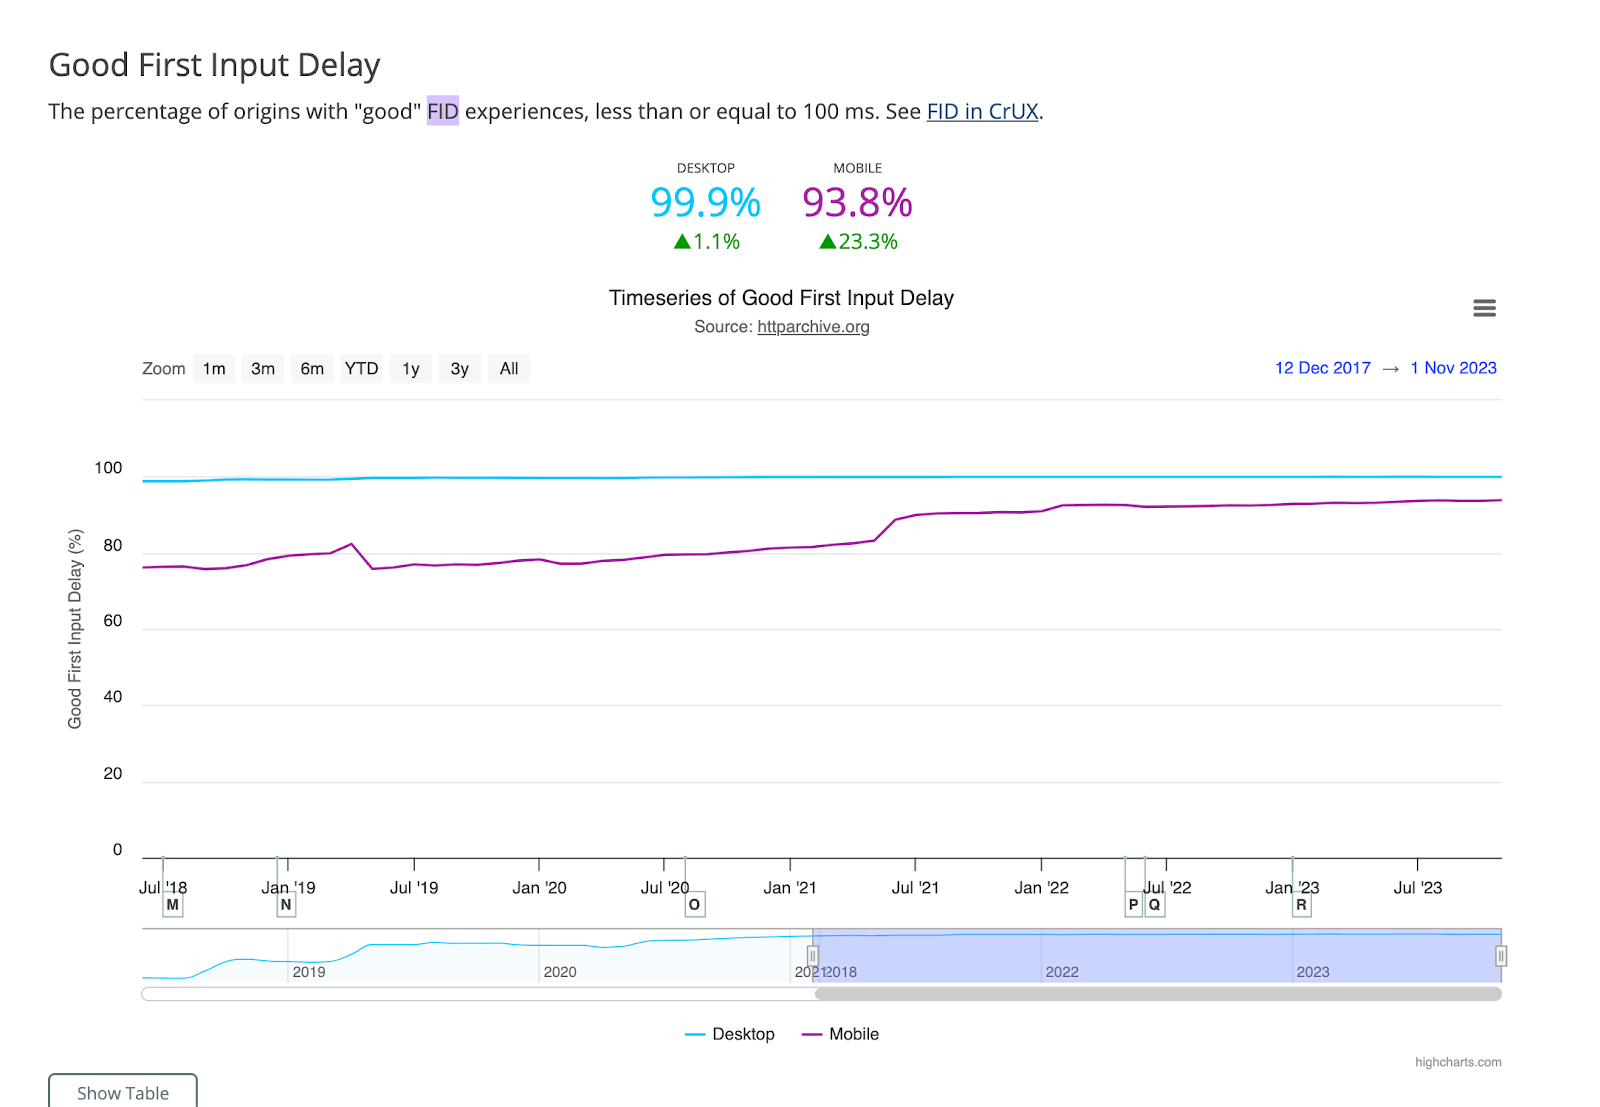
As a reference, 93.8% of mobile and 99.9% of desktop interfaces met the FID criteria. Only 64% of websites currently have a good INP score.
What goes into the INP calculation?
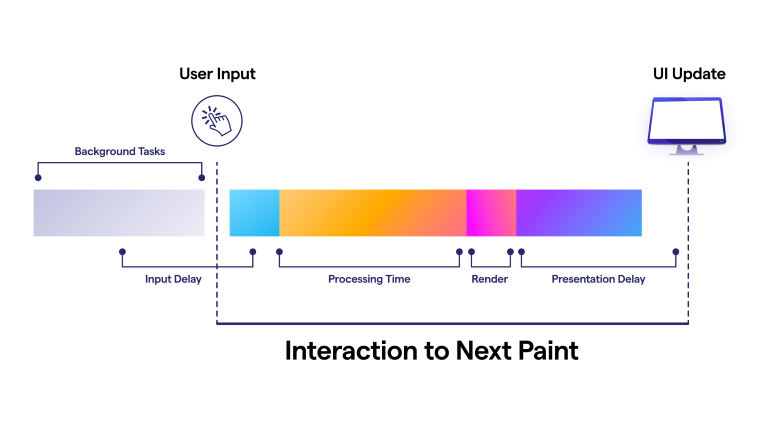
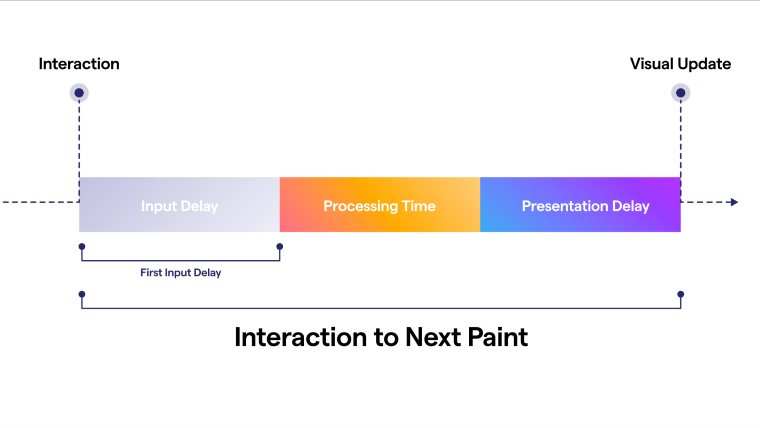
INP is composed of three key components:
- Input delay — The time between a user’s action and when the browser (CPU) starts processing that action
- Processing time — The time your browser takes to process the user’s action by running event handlers in JavaScript
- Presentation delay — The time between the processing completion and when the screen reflects those changes (i.e., “next paint”)
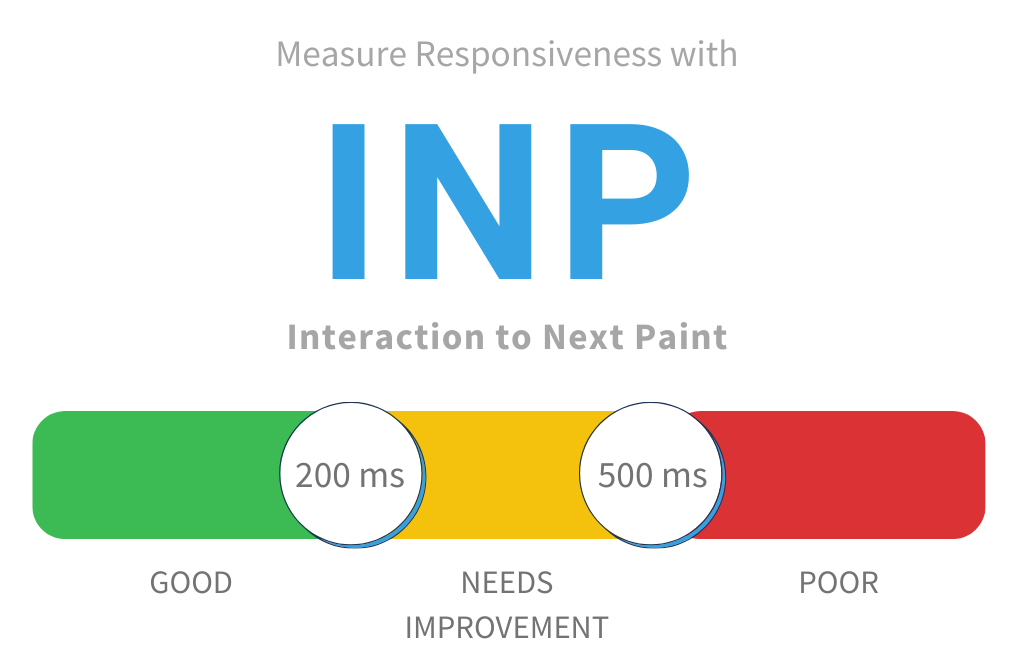
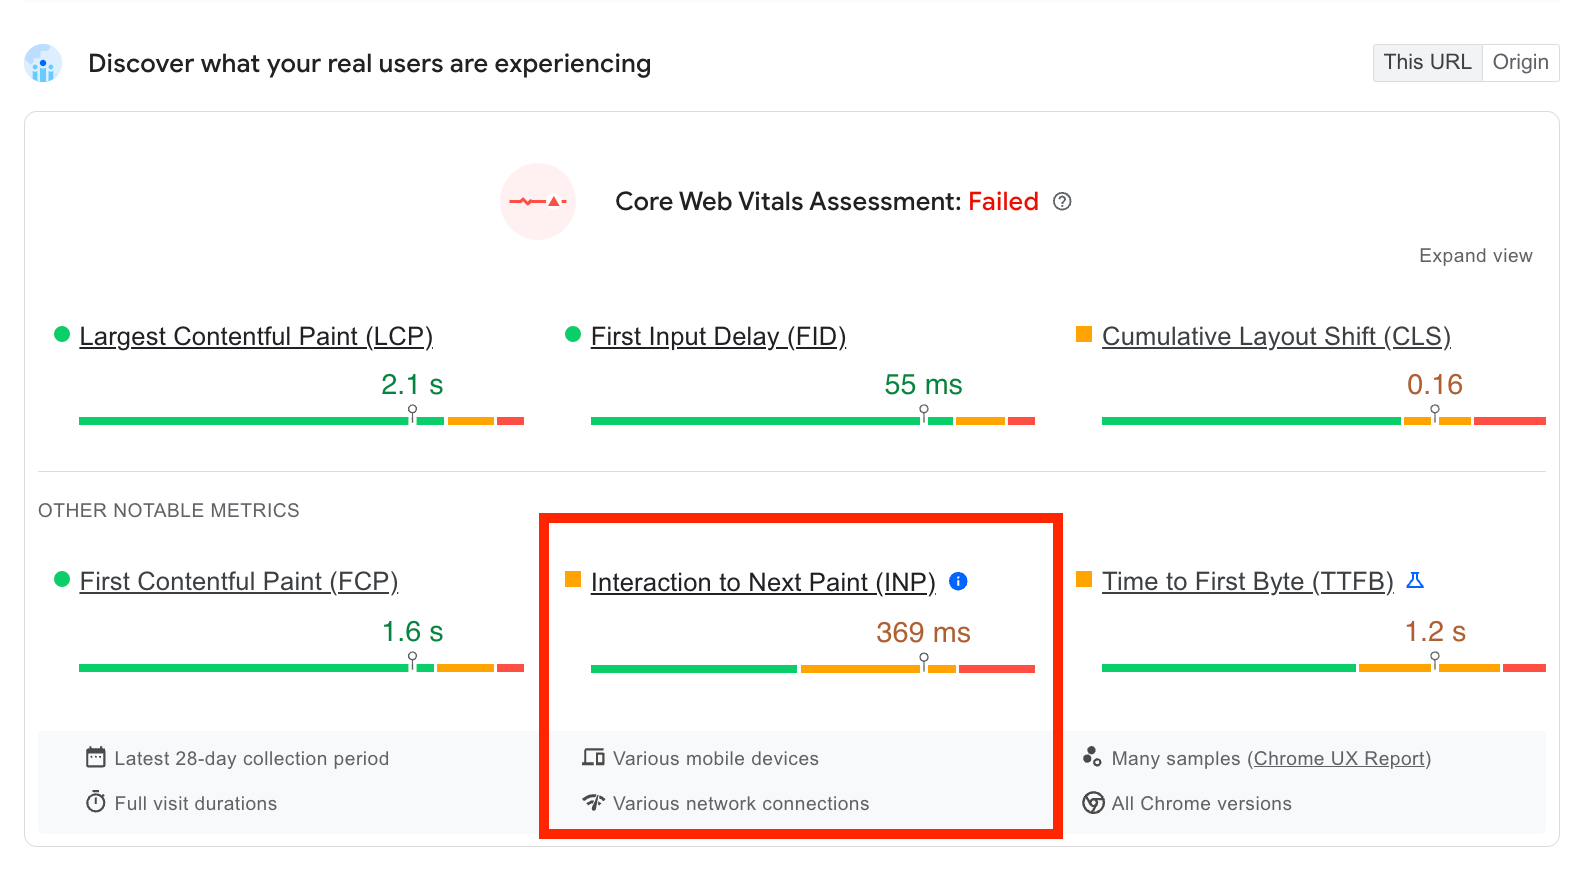
Regarding INP scores, Google provides clear benchmarks:
- An INP of 200 milliseconds or less is considered good, meaning the page is responsive.
- An INP between 200 and 500 milliseconds suggests your page responsiveness needs improvement.
- An INP above 500 milliseconds is considered poor. It indicates noticeably slow interactions and delays that could frustrate users.
How to measure INP
There are two ways to measure Interaction to Next Paint: in the field or in a lab.
Measuring INP in the field
Interaction to Next Paint is a field metric — that is, it measures the actual user experience on your website using real user data. Google collects this field data as part of its Chrome User Experience Report (or CruX report).
With field data, you’ll have context. You’ll know which user interactions are specifically responsible for INP values.
It’ll also tell you the type of interaction, whether it happened before or after the page loaded, and other critical details.
By extension, the best way to measure this Core Web Vital is to use the CrUX API.
If your website qualifies for inclusion in the CrUX report, you can see your INP scores in Google’s PageSpeed Insights tool (it’s free).
This will give you your entire Core Web Vitals report, which you can then narrow down to the diagnostics that directly impact your INP score.
At a high level, there’s one glaring problem with CrUX. It doesn’t provide nearly enough detail to fully diagnose a technical problem.
You’ll need some kind of real user monitoring solution (like Hotjar or Datadog) to drill down into the root cause of your page’s INP scores. That way, you’ll have visualizations for how each user interacted with specific UI elements.
Measuring INP in the lab
You’ll want to start testing with lab data only after you have enough user input data to reliably indicate you have a problem with poor responsiveness.
If you don’t have any real user data, there are still ways to reproduce slow page interactions in a lab setting.
- User flows — Have a test user complete specific tasks on your website and check INP scores.
- Synthetic monitoring — Use automated tools to simulate clicks, taps, and keystrokes from multiple locations globally.
- Interacting with the page during load — You can surface slow interactions by interacting when the main thread is busy, and Google’s Lighthouse will report it in the lab data.
But keep in mind that lab data doesn’t always reflect real-world performance. So, while it’s helpful for initial troubleshooting, you’ll still need to collect field data for comprehensive analysis.

How to optimize Interaction to Next Paint scores
If you want your site to perform well on Google search, you’ll want to perform a Core Web Vitals audit. That’s how you know where to start looking when it comes to improving your overall site experience (and, by extension, search engine rankings).
Other Core Web Vitals metrics have their own unique optimization strategies. But here’s a rundown of everything you should do to improve INP scores:
1. Start with the Core Web Vitals report in Google Search Console.
In GSC, the Core Web Vitals tab now includes a section letting you know to prepare for the upcoming changes in 2024.
If your site is all good, you might only see this:
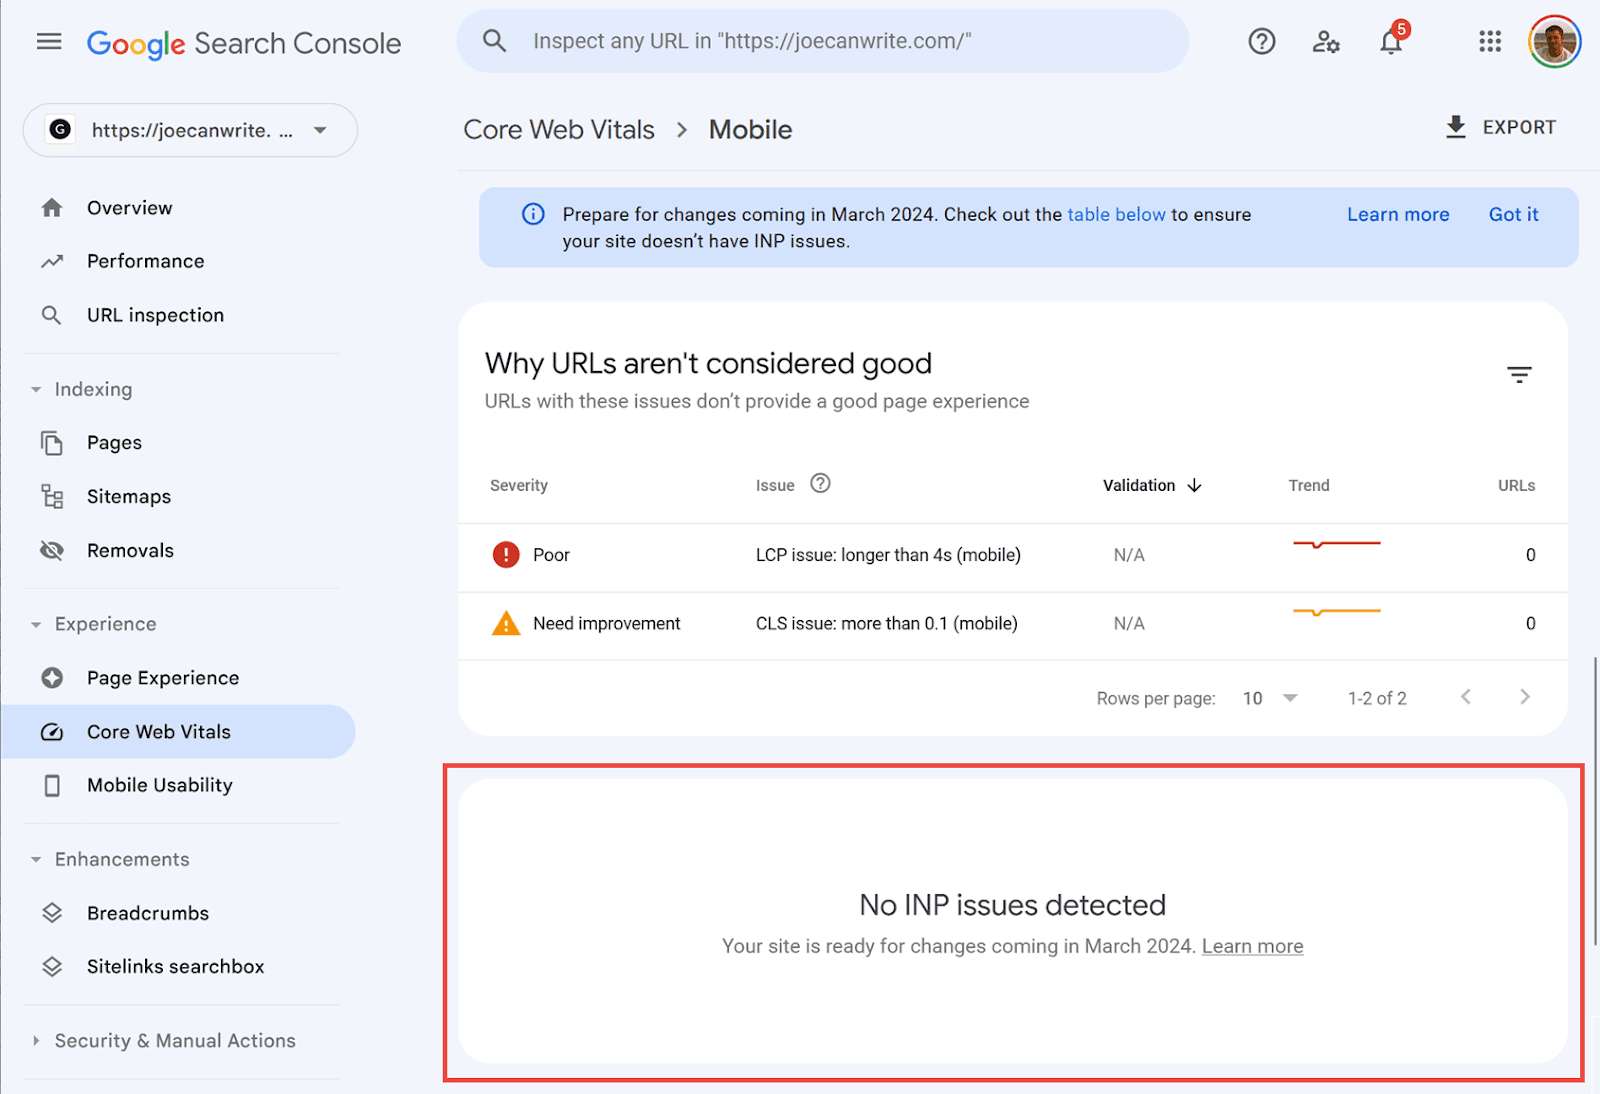
But, look for the problems underneath “Prepare for changes coming in March 2024.” They’ll either be red and labeled “Poor” or yellow and labeled “Need improvement.”
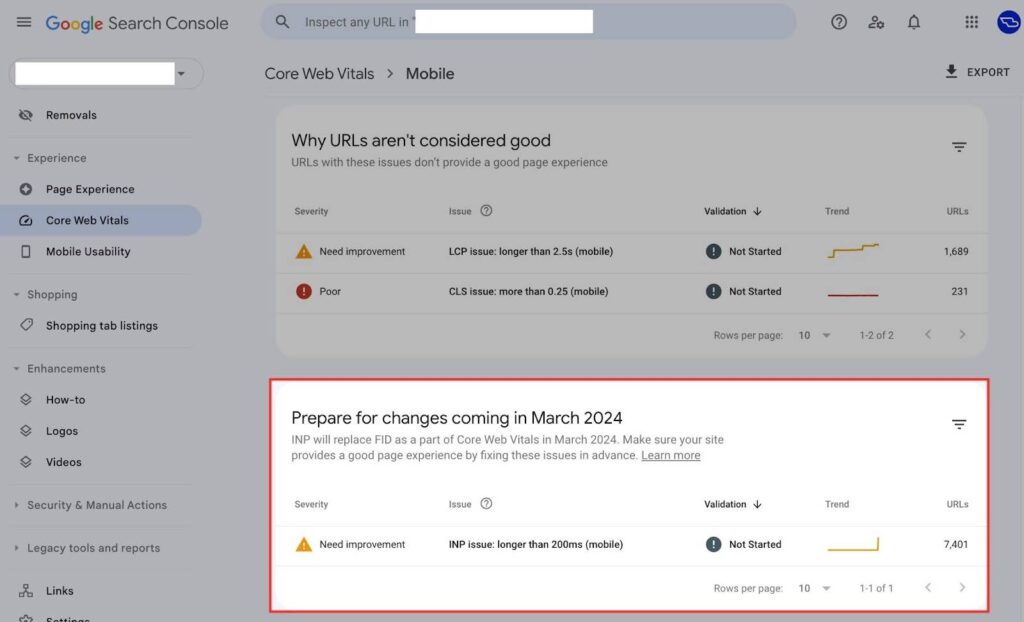
Once you click on those, you’ll see which URLs are too slow.
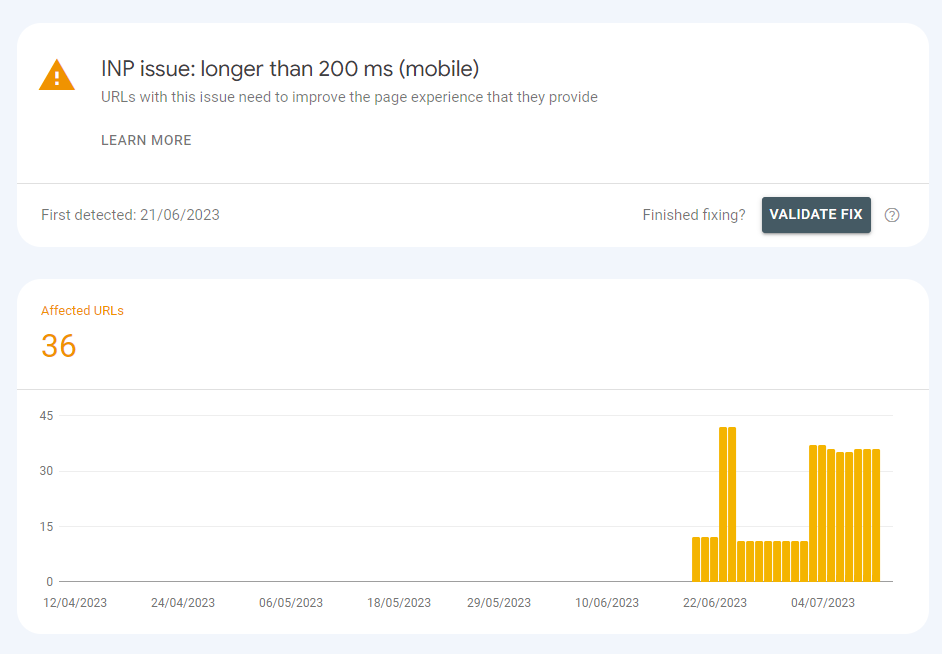
From there, you’ll know where on your website you have to optimize.
Once you have this basic info, you have four options (which I briefly mentioned above).
- Using an INP debugger
- Testing your web pages manually with Chrome DevTools
- Creating user flows with Google Lighthouse
- Using a real user monitoring (RUM) software
Now, I’ll walk you through each of these processes.
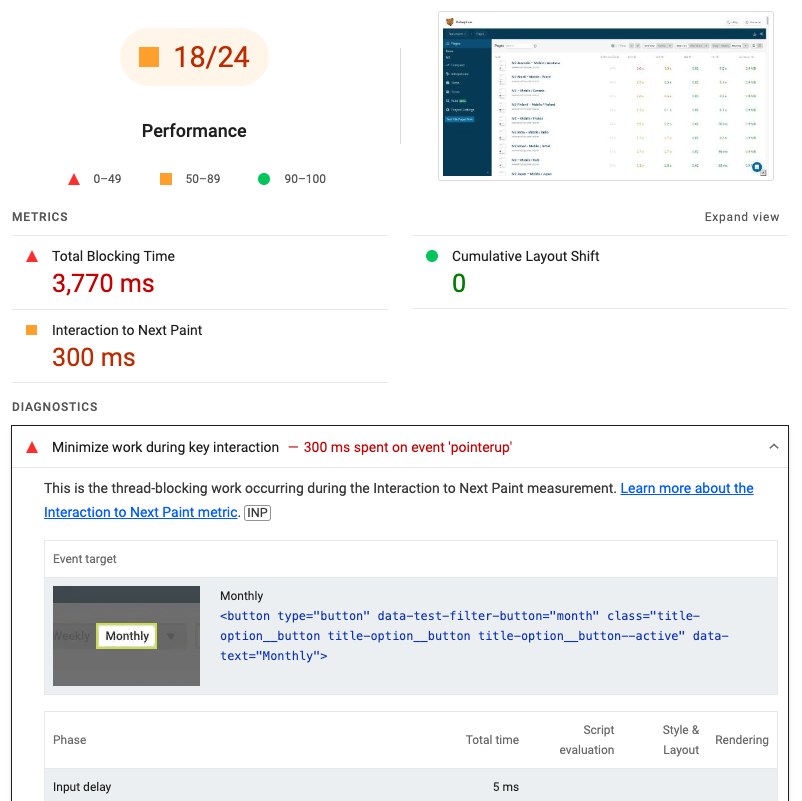
2. Use an INP debugger.
An INP debugger is third-party software you can use to diagnose UX performance problems. DebugBear has a free INP debugger you can use for this purpose.
Your site needs to be a part of CrUX, though, to use it.
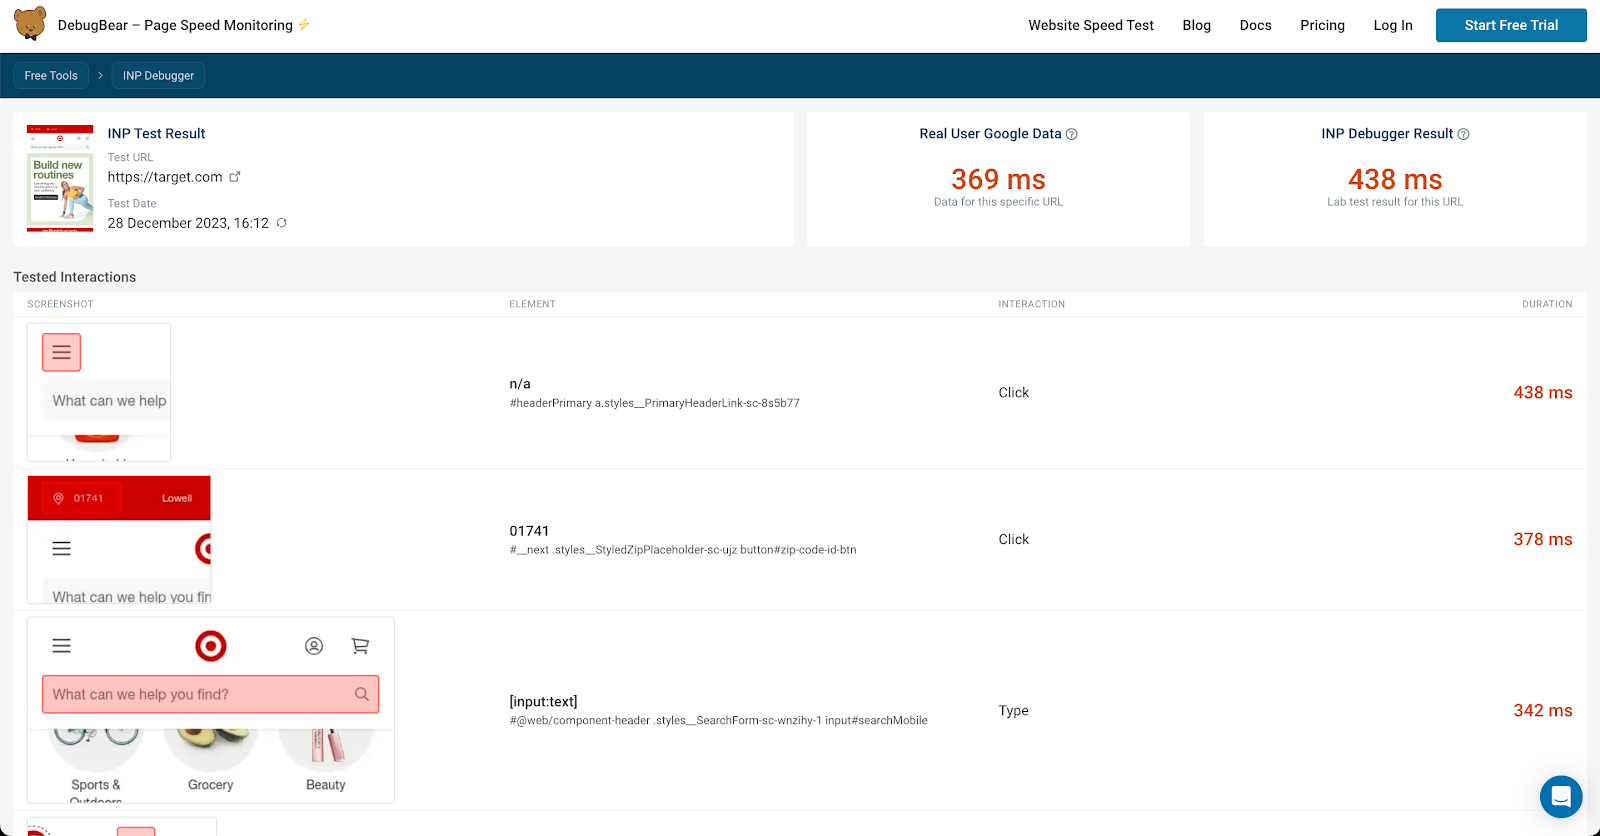
A debugger makes it easy to see which page elements cause slow interactions on your site (though it can’t tell you how often users interact with them).
This is the logical next step in your optimization process because it shows you visually where you need to focus.
It’s worth mentioning, however, this process is primarily for basic UI elements — it doesn’t work well for complex user flows.
Suppose a user adds something to a shopping cart and has trouble in the checkout funnel. The debugger wouldn’t detect this.
3. Test your web pages manually with Chrome DevTools.
For complex INP issues, pages that require login, or to add more context to your debugger’s results, you’ll have to use Google Chrome’s developer tools.
The Performance tab lets you record an interaction and analyze it.
- Open the Performance tab in DevTools.
- Click “Start Recording.”
- Click the UI element you want to investigate.
- Stop recording the page.
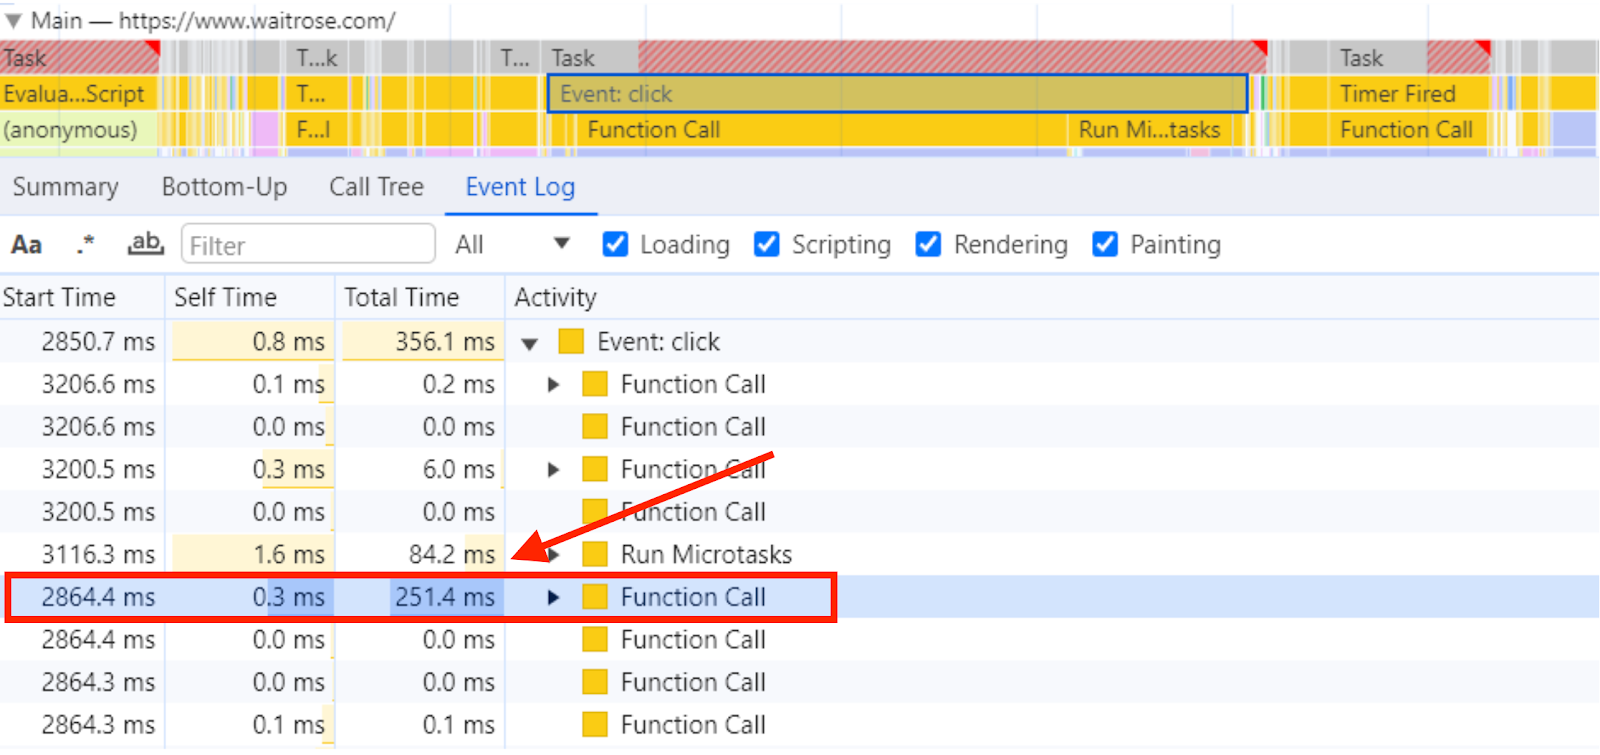
- Open the “Interactions” section on the performance profiling tool.
- Look at the “Main” lane to see what the CPQ did and what’s responsible for the delay.
The ongoing work on the main thread comes before the interaction under inspection. The main thread needs to finish its current work before moving onto the interaction.
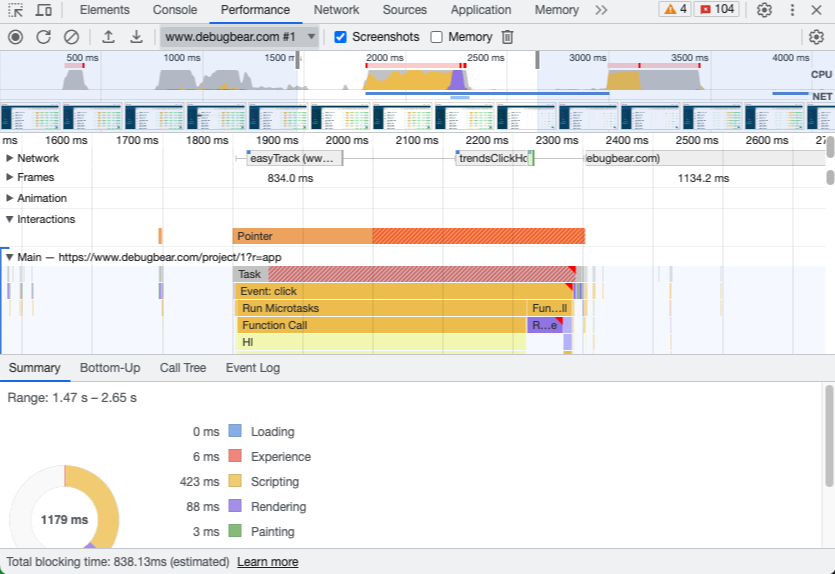
When you look at it closer, you’ll know what causes your slow interactions. It’s the item (in this case, a function call) that takes up the bulk of the total interaction time.
4. Create user flows with Google Lighthouse.
Next, you have to look at them a little more closely. While DevTools gives you a broad look at your page, Lighthouse will tell you exactly what went wrong.
Lighthouse audits both lab and field data, so you’ll see which of your user interactions are the slowest. You can then use this to pinpoint where most performance headaches come from.
Run Lighthouse within DevTools. That way, you can manually interact with the page while recording each user input.
Or, you can write code to trigger interactions and run Lighthouse automatically (and make retesting your site a lot easier).
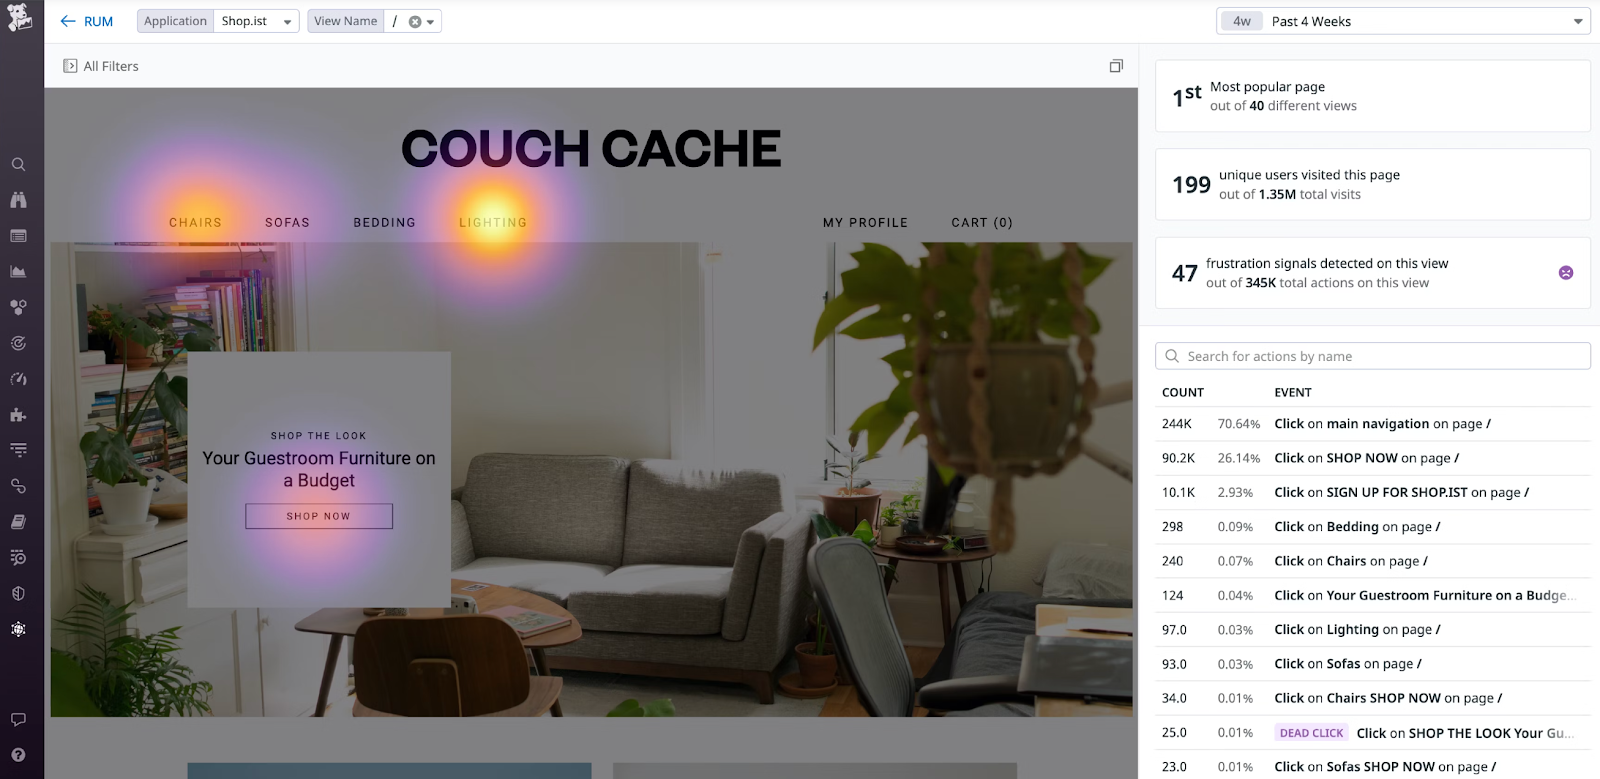
5. Use a real user monitoring (RUM) software.
The most accurate way to test your site for poor responsiveness is by using RUM software. This will give you a comprehensive dashboard of all your pages, not just an isolated test.
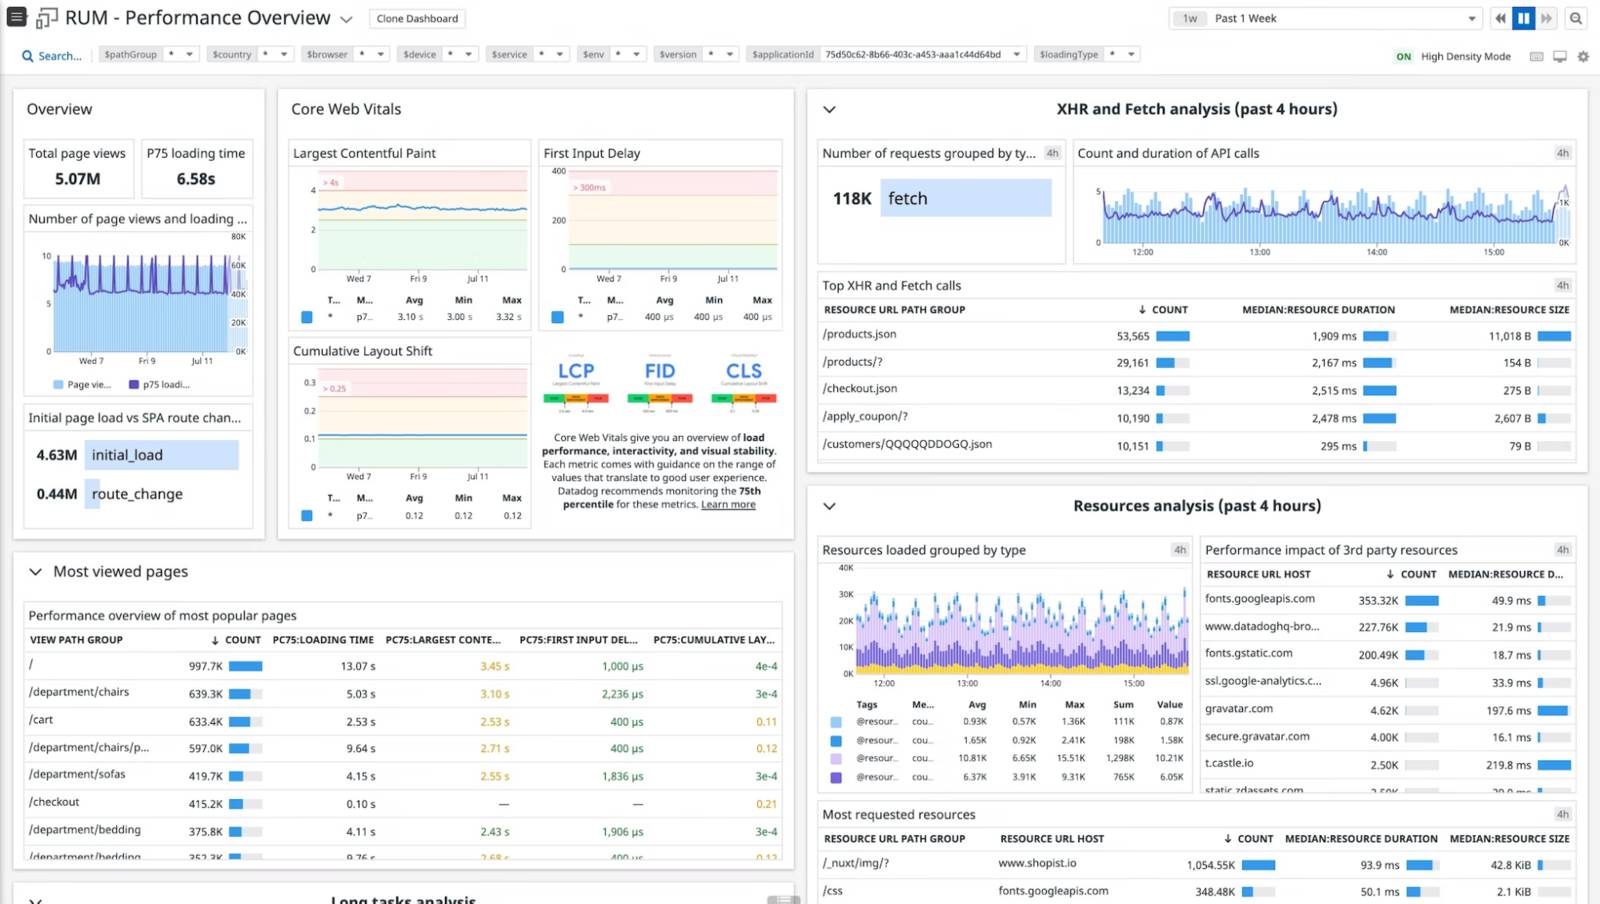
With RUM software, you’ll be able to see how your users interact with your site in detail (plus all your Core Web Vitals metrics).
They normally have heatmapping, live recording, and other features that help you understand exactly how your website visitors are navigating across your site as well.
Fixing your website’s INP issues
Identifying slow interactions is one thing. Fixing the things that cause them is a whole other.
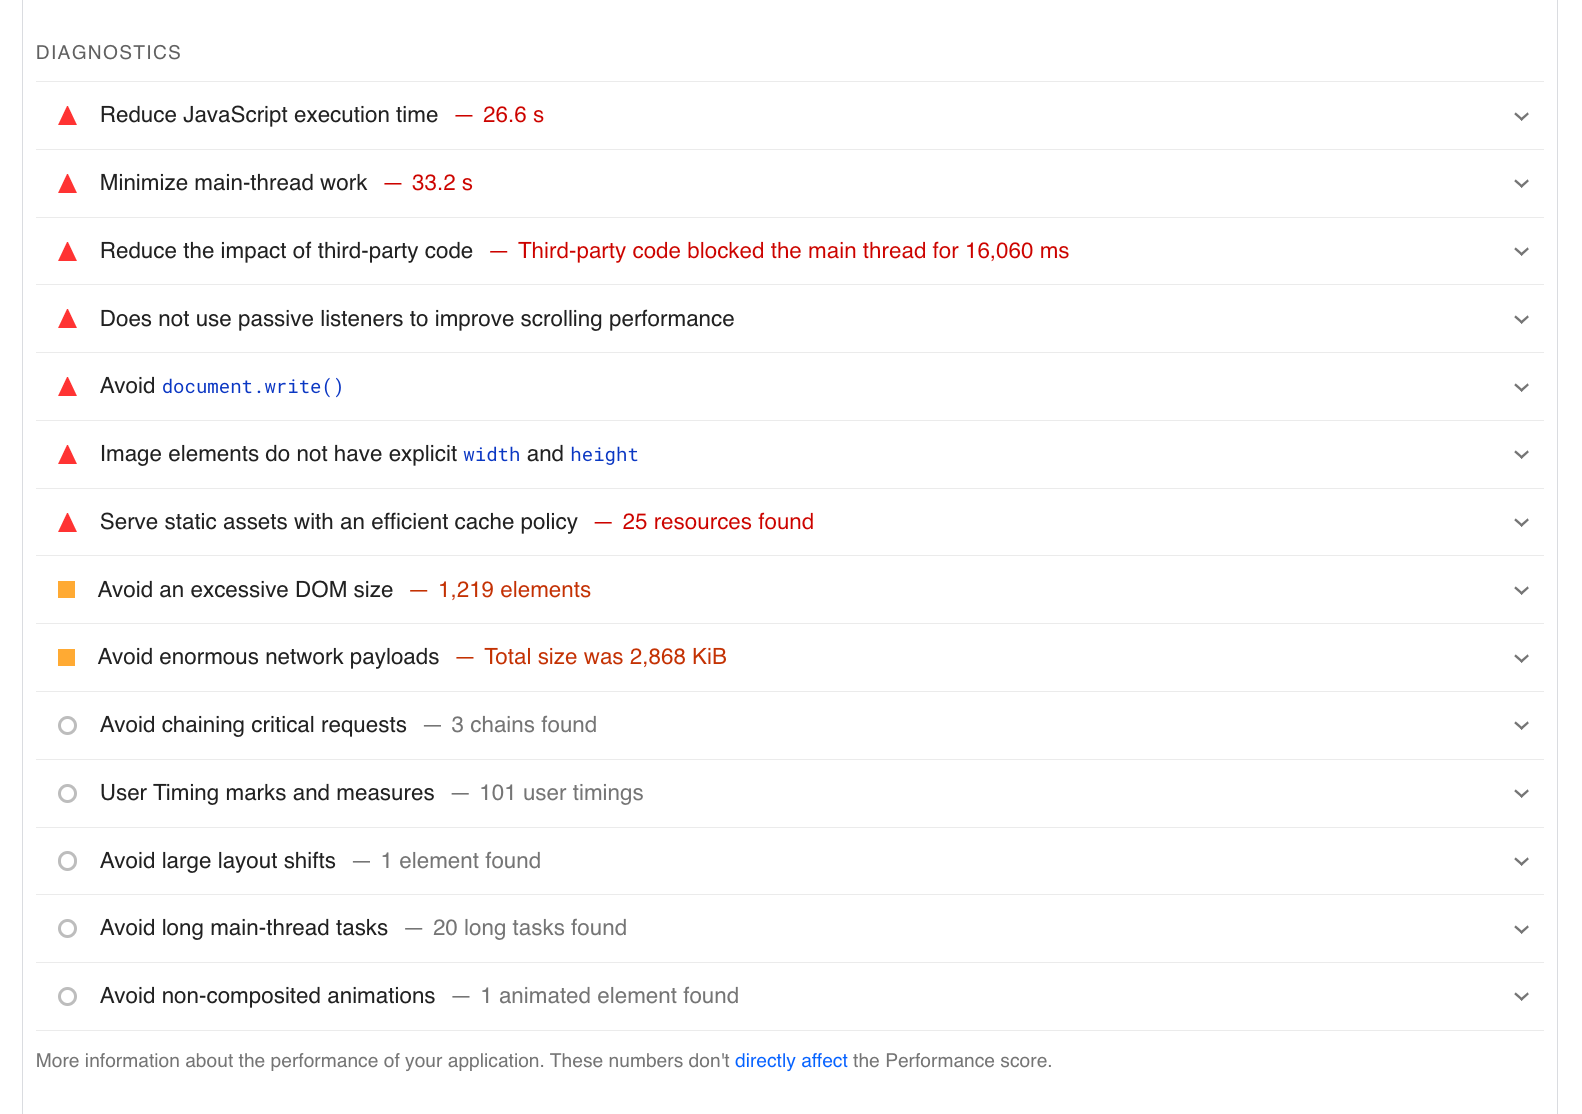
Common problems I see include:
- Third-party code blocking the CPU
- Expensive layout calculations, typically caused by poor CSS
- Custom slider menu animations for desktop
- Complex interactions on mobile
- Large images that take too long to load on mobile devices
How to fix it (and the development time it takes to do so) depends heavily on the problem in question.
The easy way: work with an agency!
Having someone in your corner who cares about your SEO conversion rate (not just traffic) means identifying and fixing problems with INP, other Core Web Vitals metrics, and the overarching site experience is just as much their problem as it is yours.
Plus, working with an agency means you’ll have access to all the tools you need (and a team of experts) to make your site lightning-fast.